

How to use Exact Flow Diagnostics and Data Erasure Software
Learn How to use Exact Flow Diagnostics and Data Erasure Software with this helpful tutorial from Zip Tutorials.
Created By:  Yasin126
Published on August 10, 2026
8 Steps
Step 1:
Login and downloads
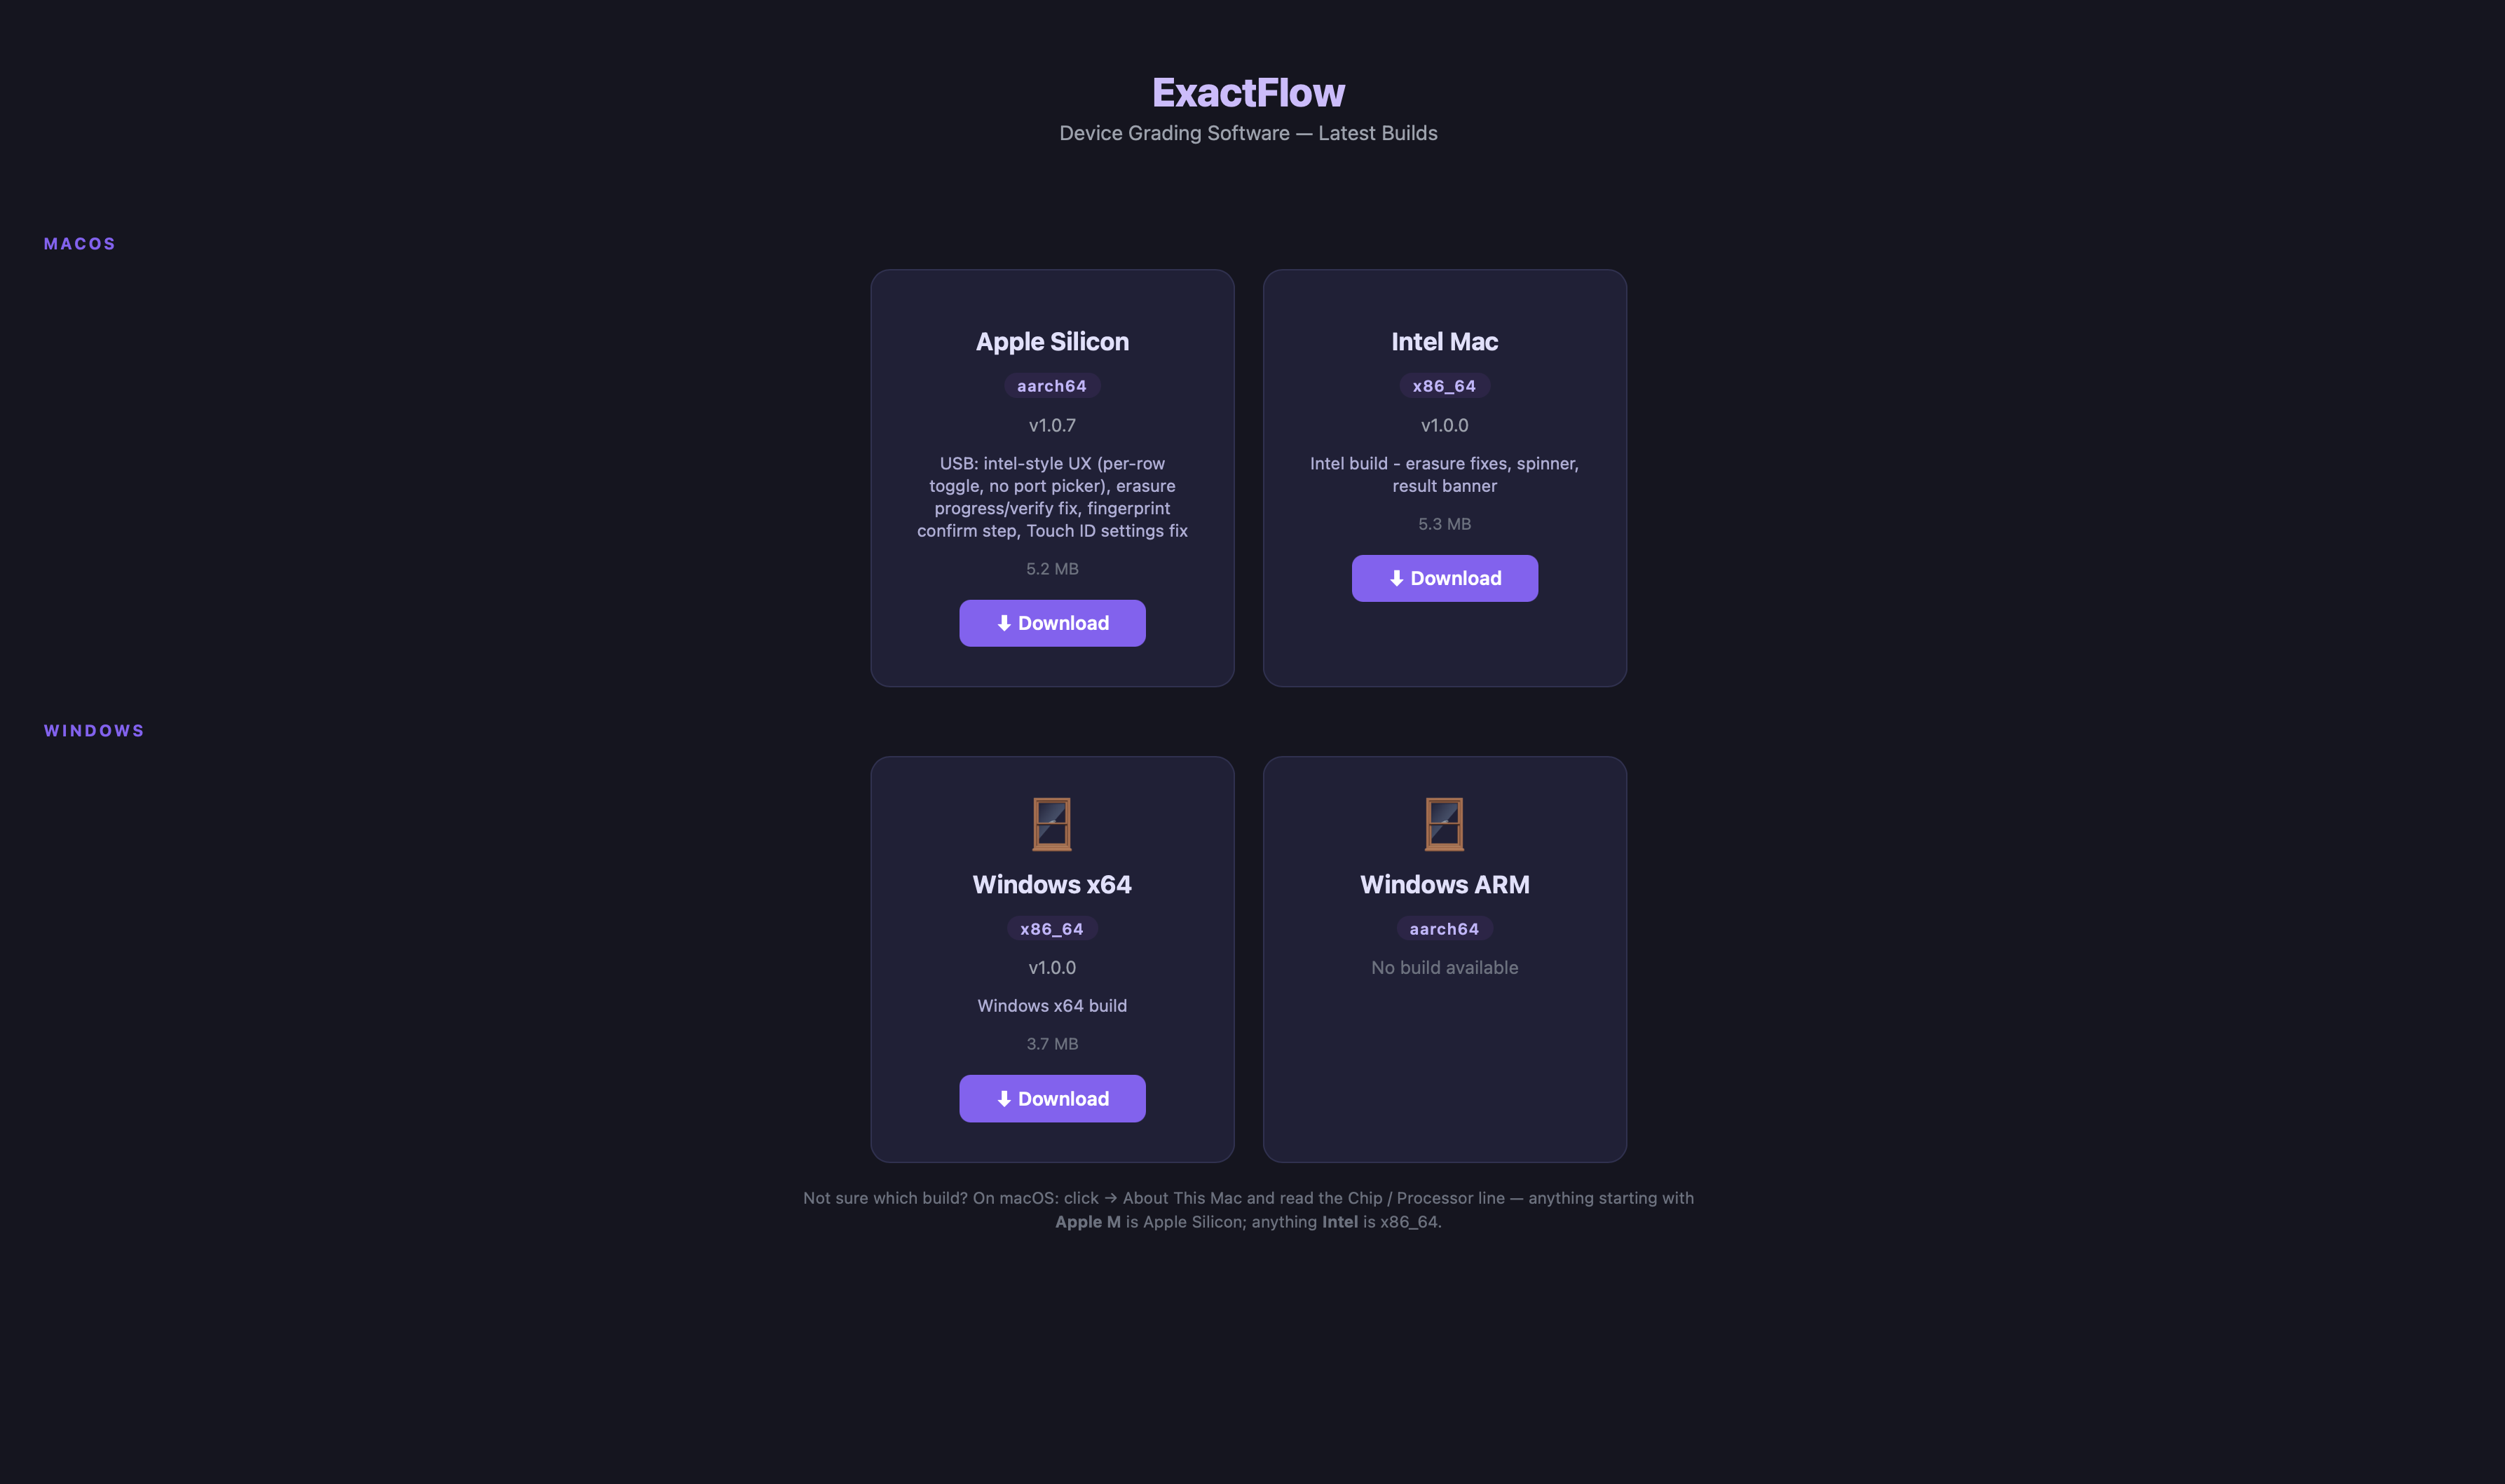
Accessing the Application and Downloads. 1. Navigate to the Exact Flow: https://exactflow-grading.fly.dev/admin/analytics/ 2. Log in using the provided credentials. The same credentials can be used to access the application. 3. Once logged in, locate Downloads in the left-hand sidebar. 4. Click Downloads to open the downloads section. 5. The Downloads page provides application builds for different operating environments, including: macOS – Apple Silicon | macOS – Intel | Windows. 6. Select and download the appropriate build based on the user's device and operating system.
Step 2:
Web Portal
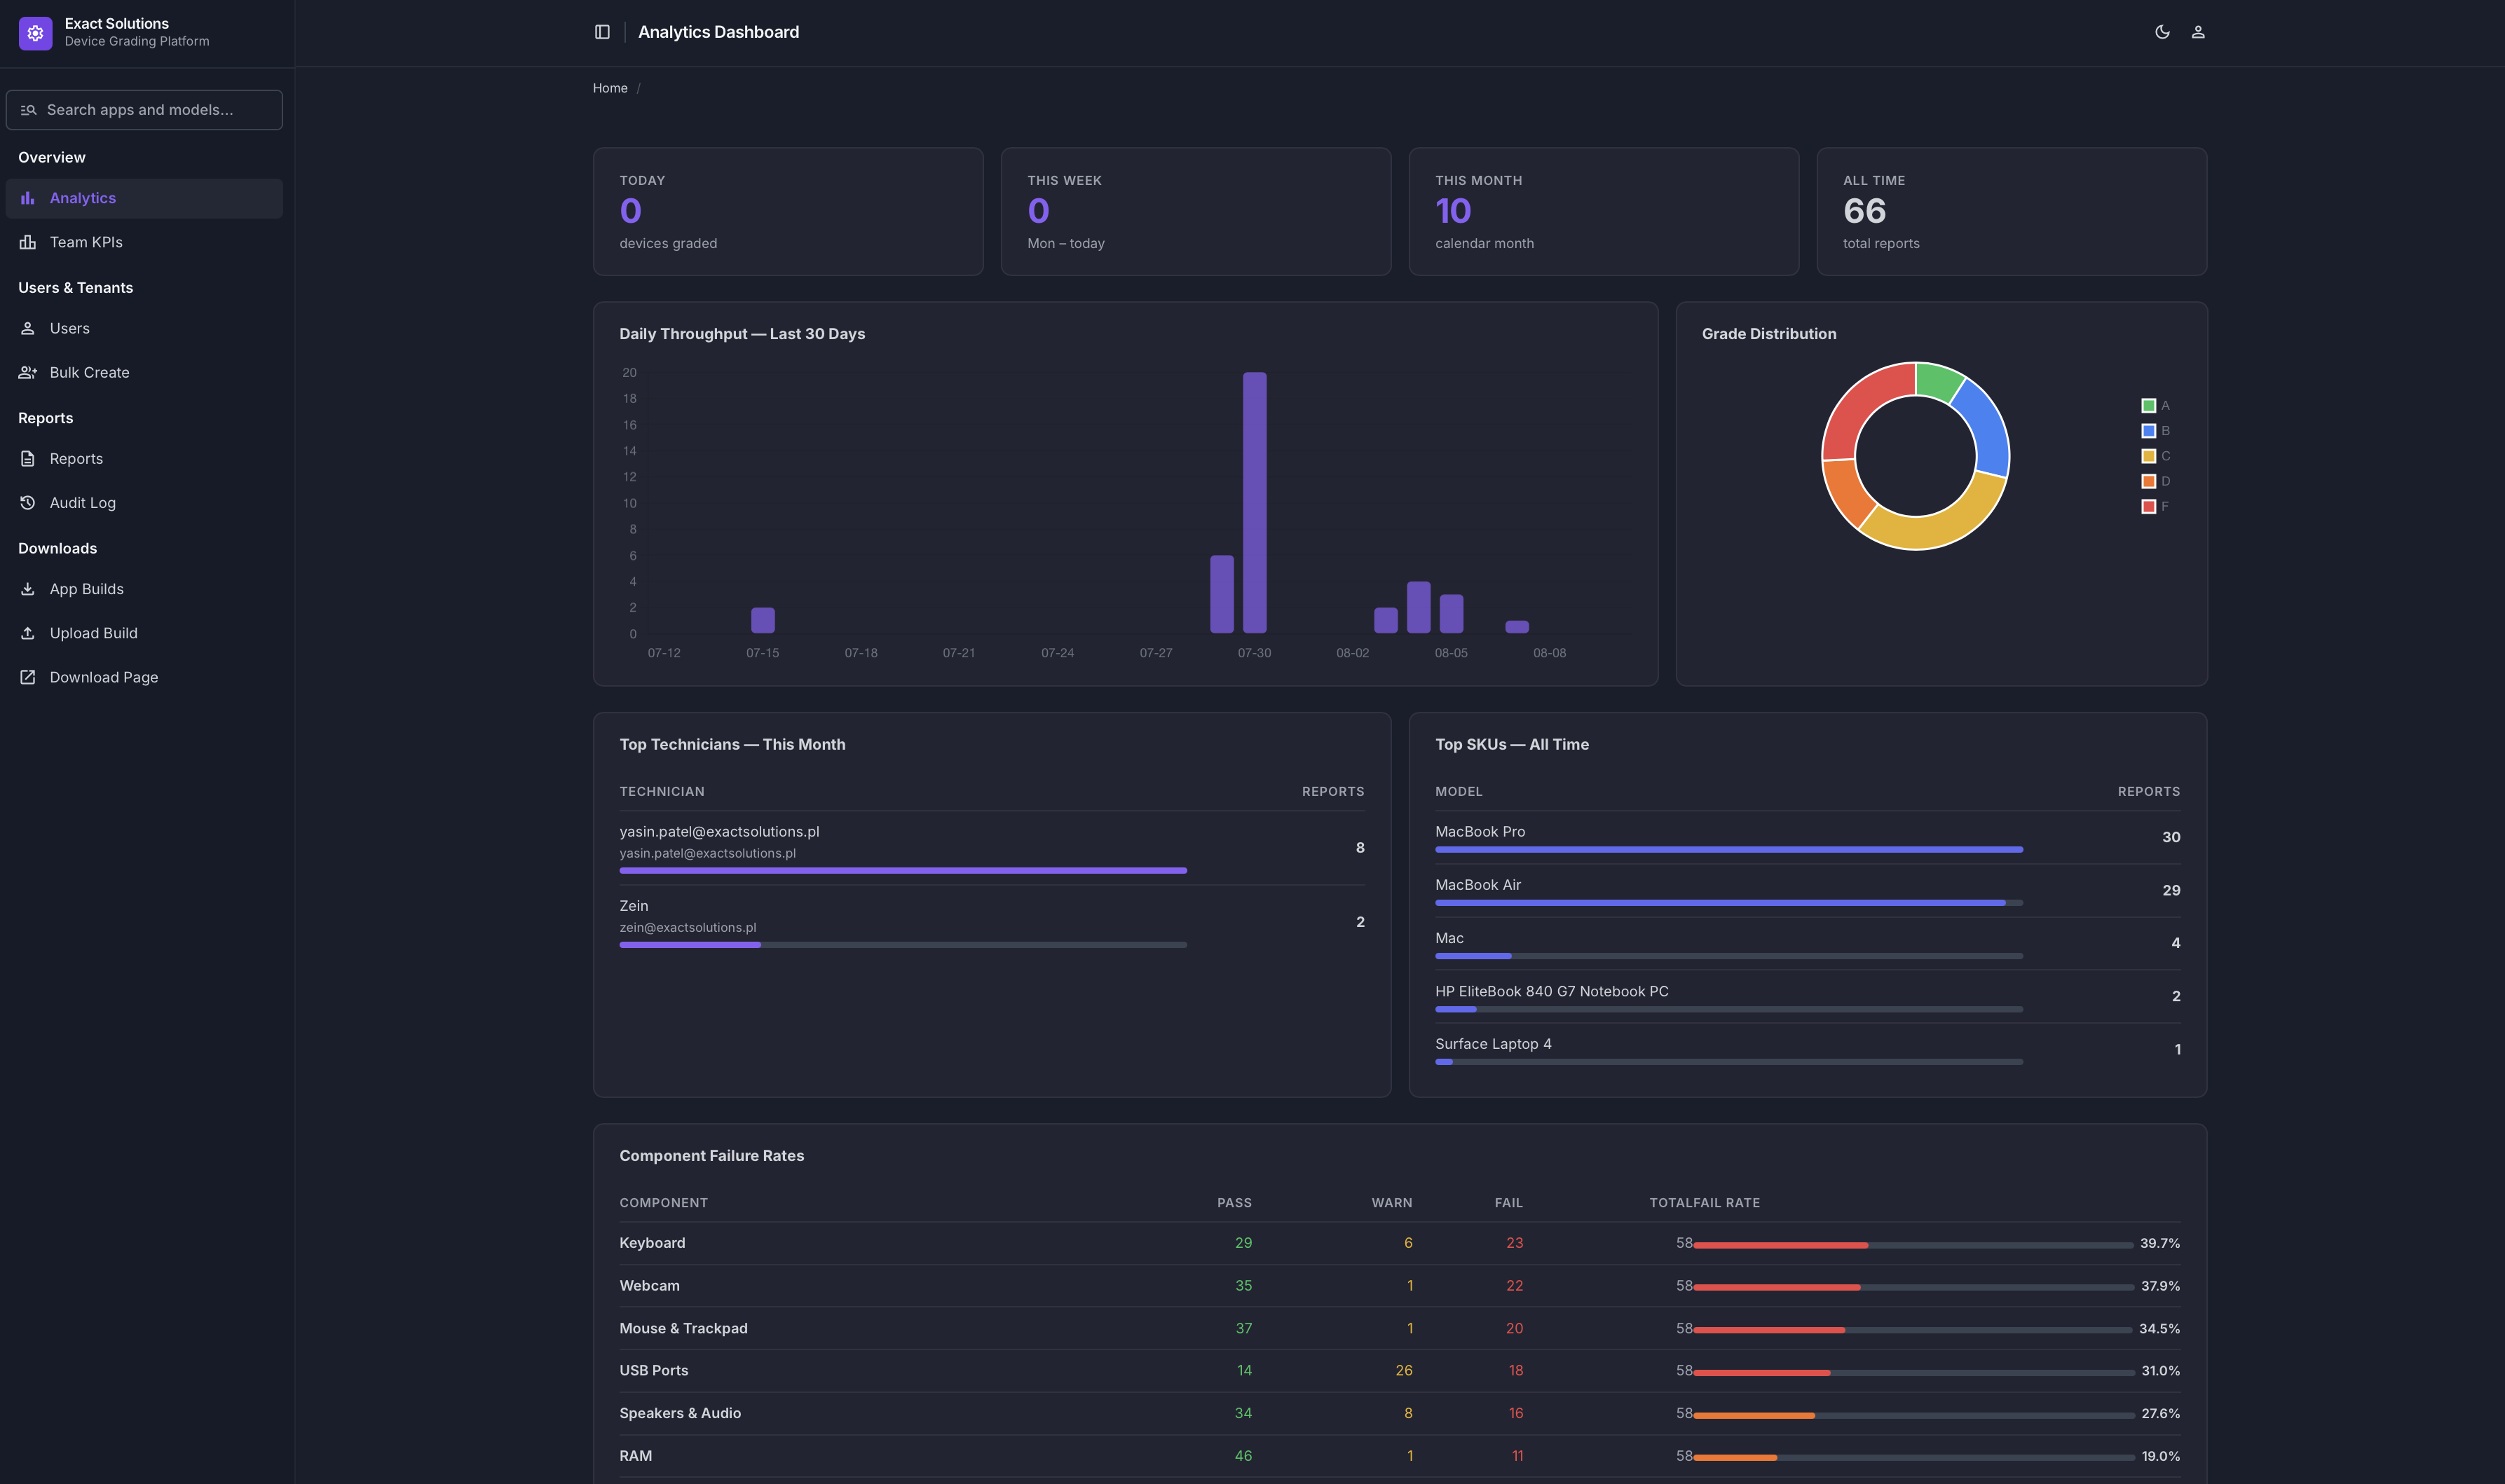
The Web Portal provides administrators with access to reporting, team performance, and detailed analytics. Administrators can access: -Reports for reviewing application and operational data. -Team KPIs to monitor team performance and key metrics. -Detailed Analytics, including component failure rates, top-performing products/SKUs, and top-performing team members. -Users & Tenants: The Users and Tenants sections allow administrators to manage users. Administrators can: Create new users, Delete existing users, and manage users without requiring an email address. -Creating a New User: 1. Navigate to the Users section. 2. Click the + (Plus) icon in the top-right corner. 3. Enter the required user details. 4. Save the new user. Note: An email address is not required when creating a user.
Step 3:
Application- Setup
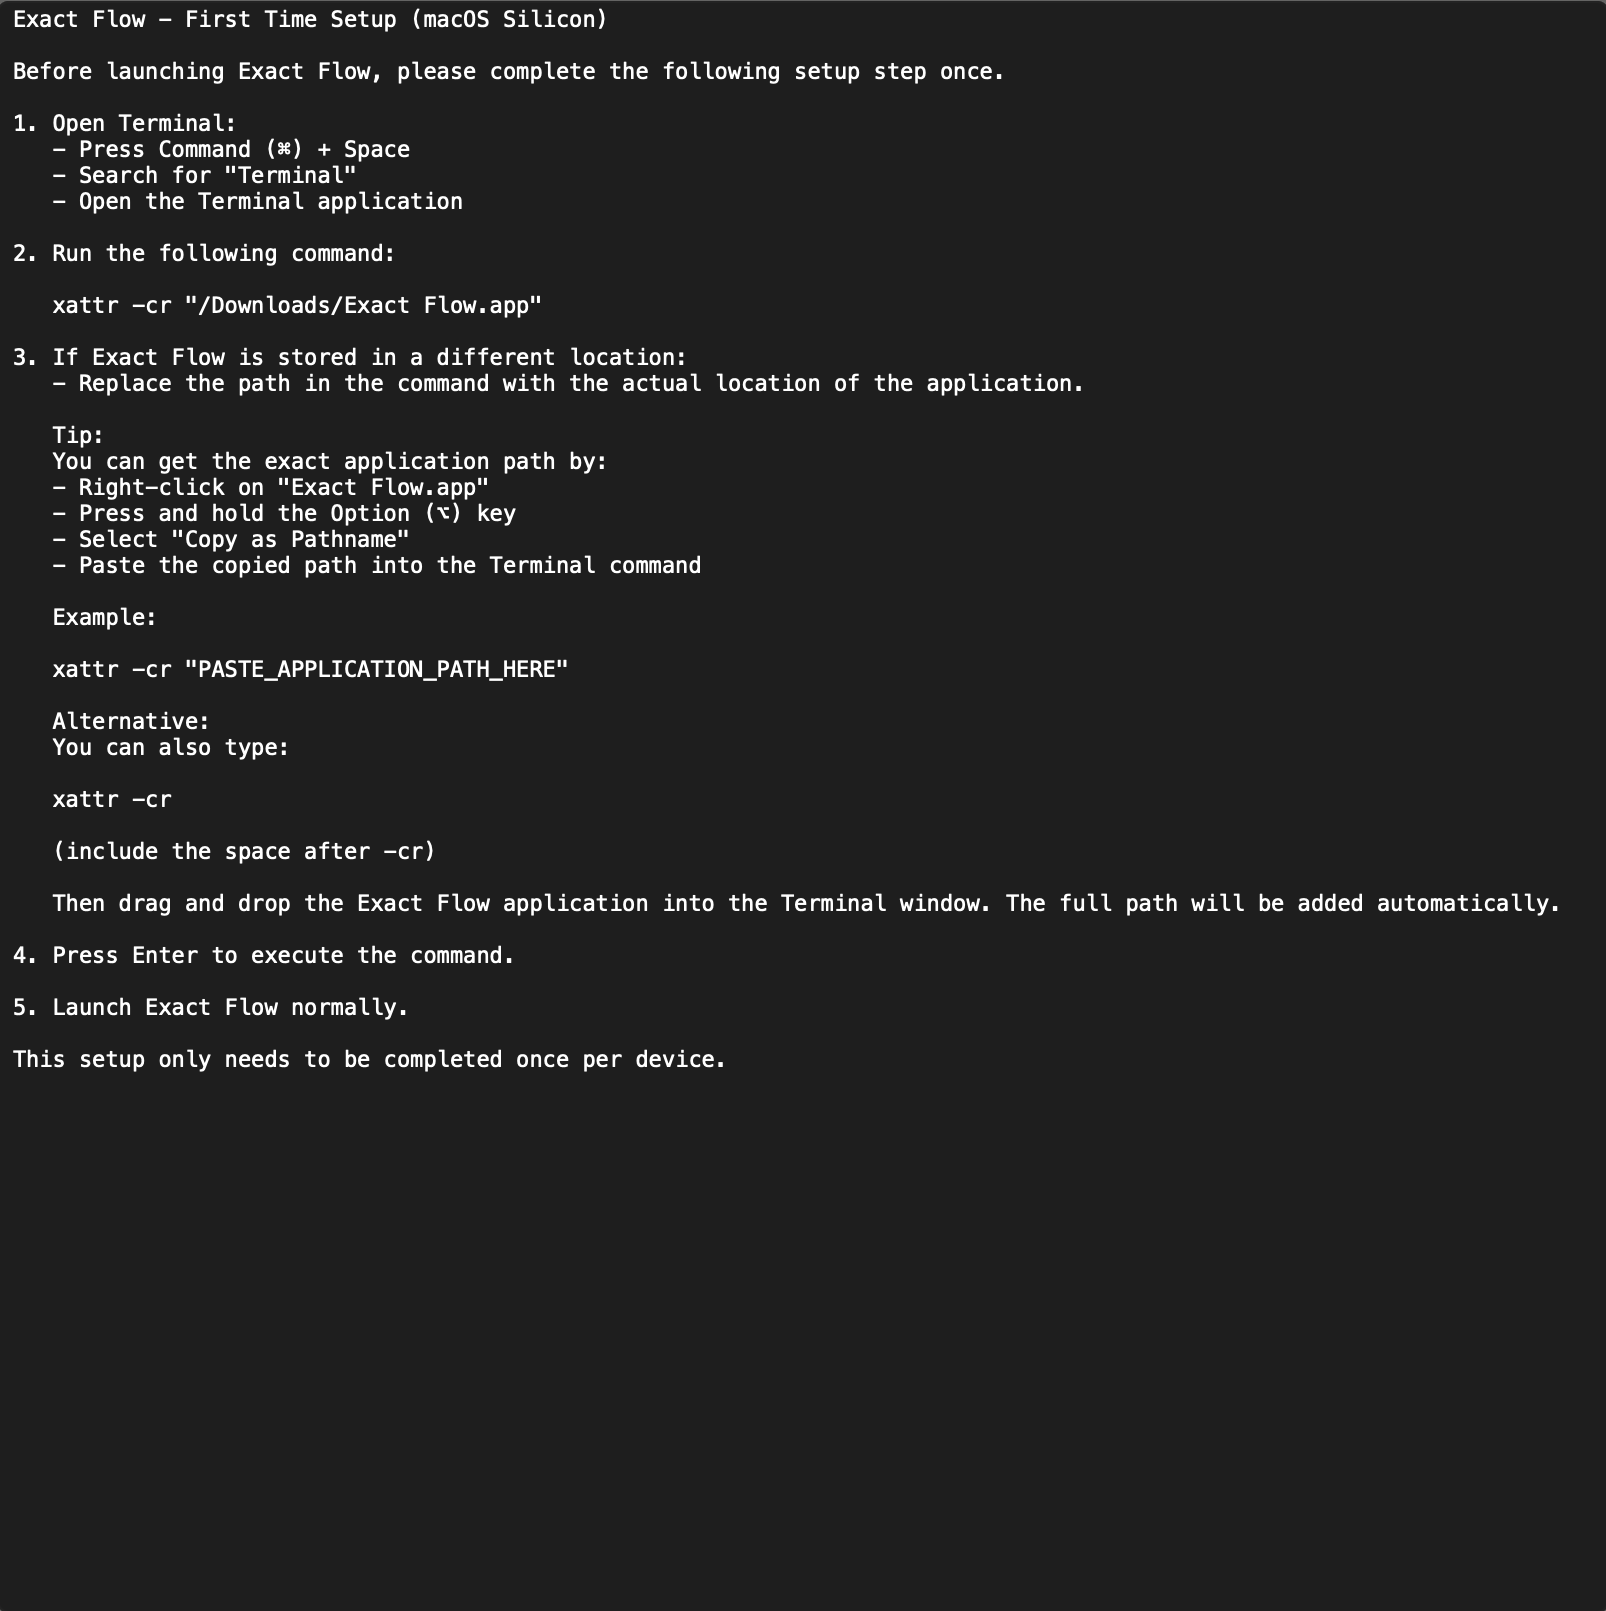
The downloaded application ZIP package includes a README file with the setup instructions. The setup process is straightforward; however, please review the README before starting, as the installation steps differ between Intel and Apple Silicon environments. **Note: Once application notarization is completed, the additional setup steps will no longer be required, making the installation process even simpler.
Step 4:
Application Overview — Device Info
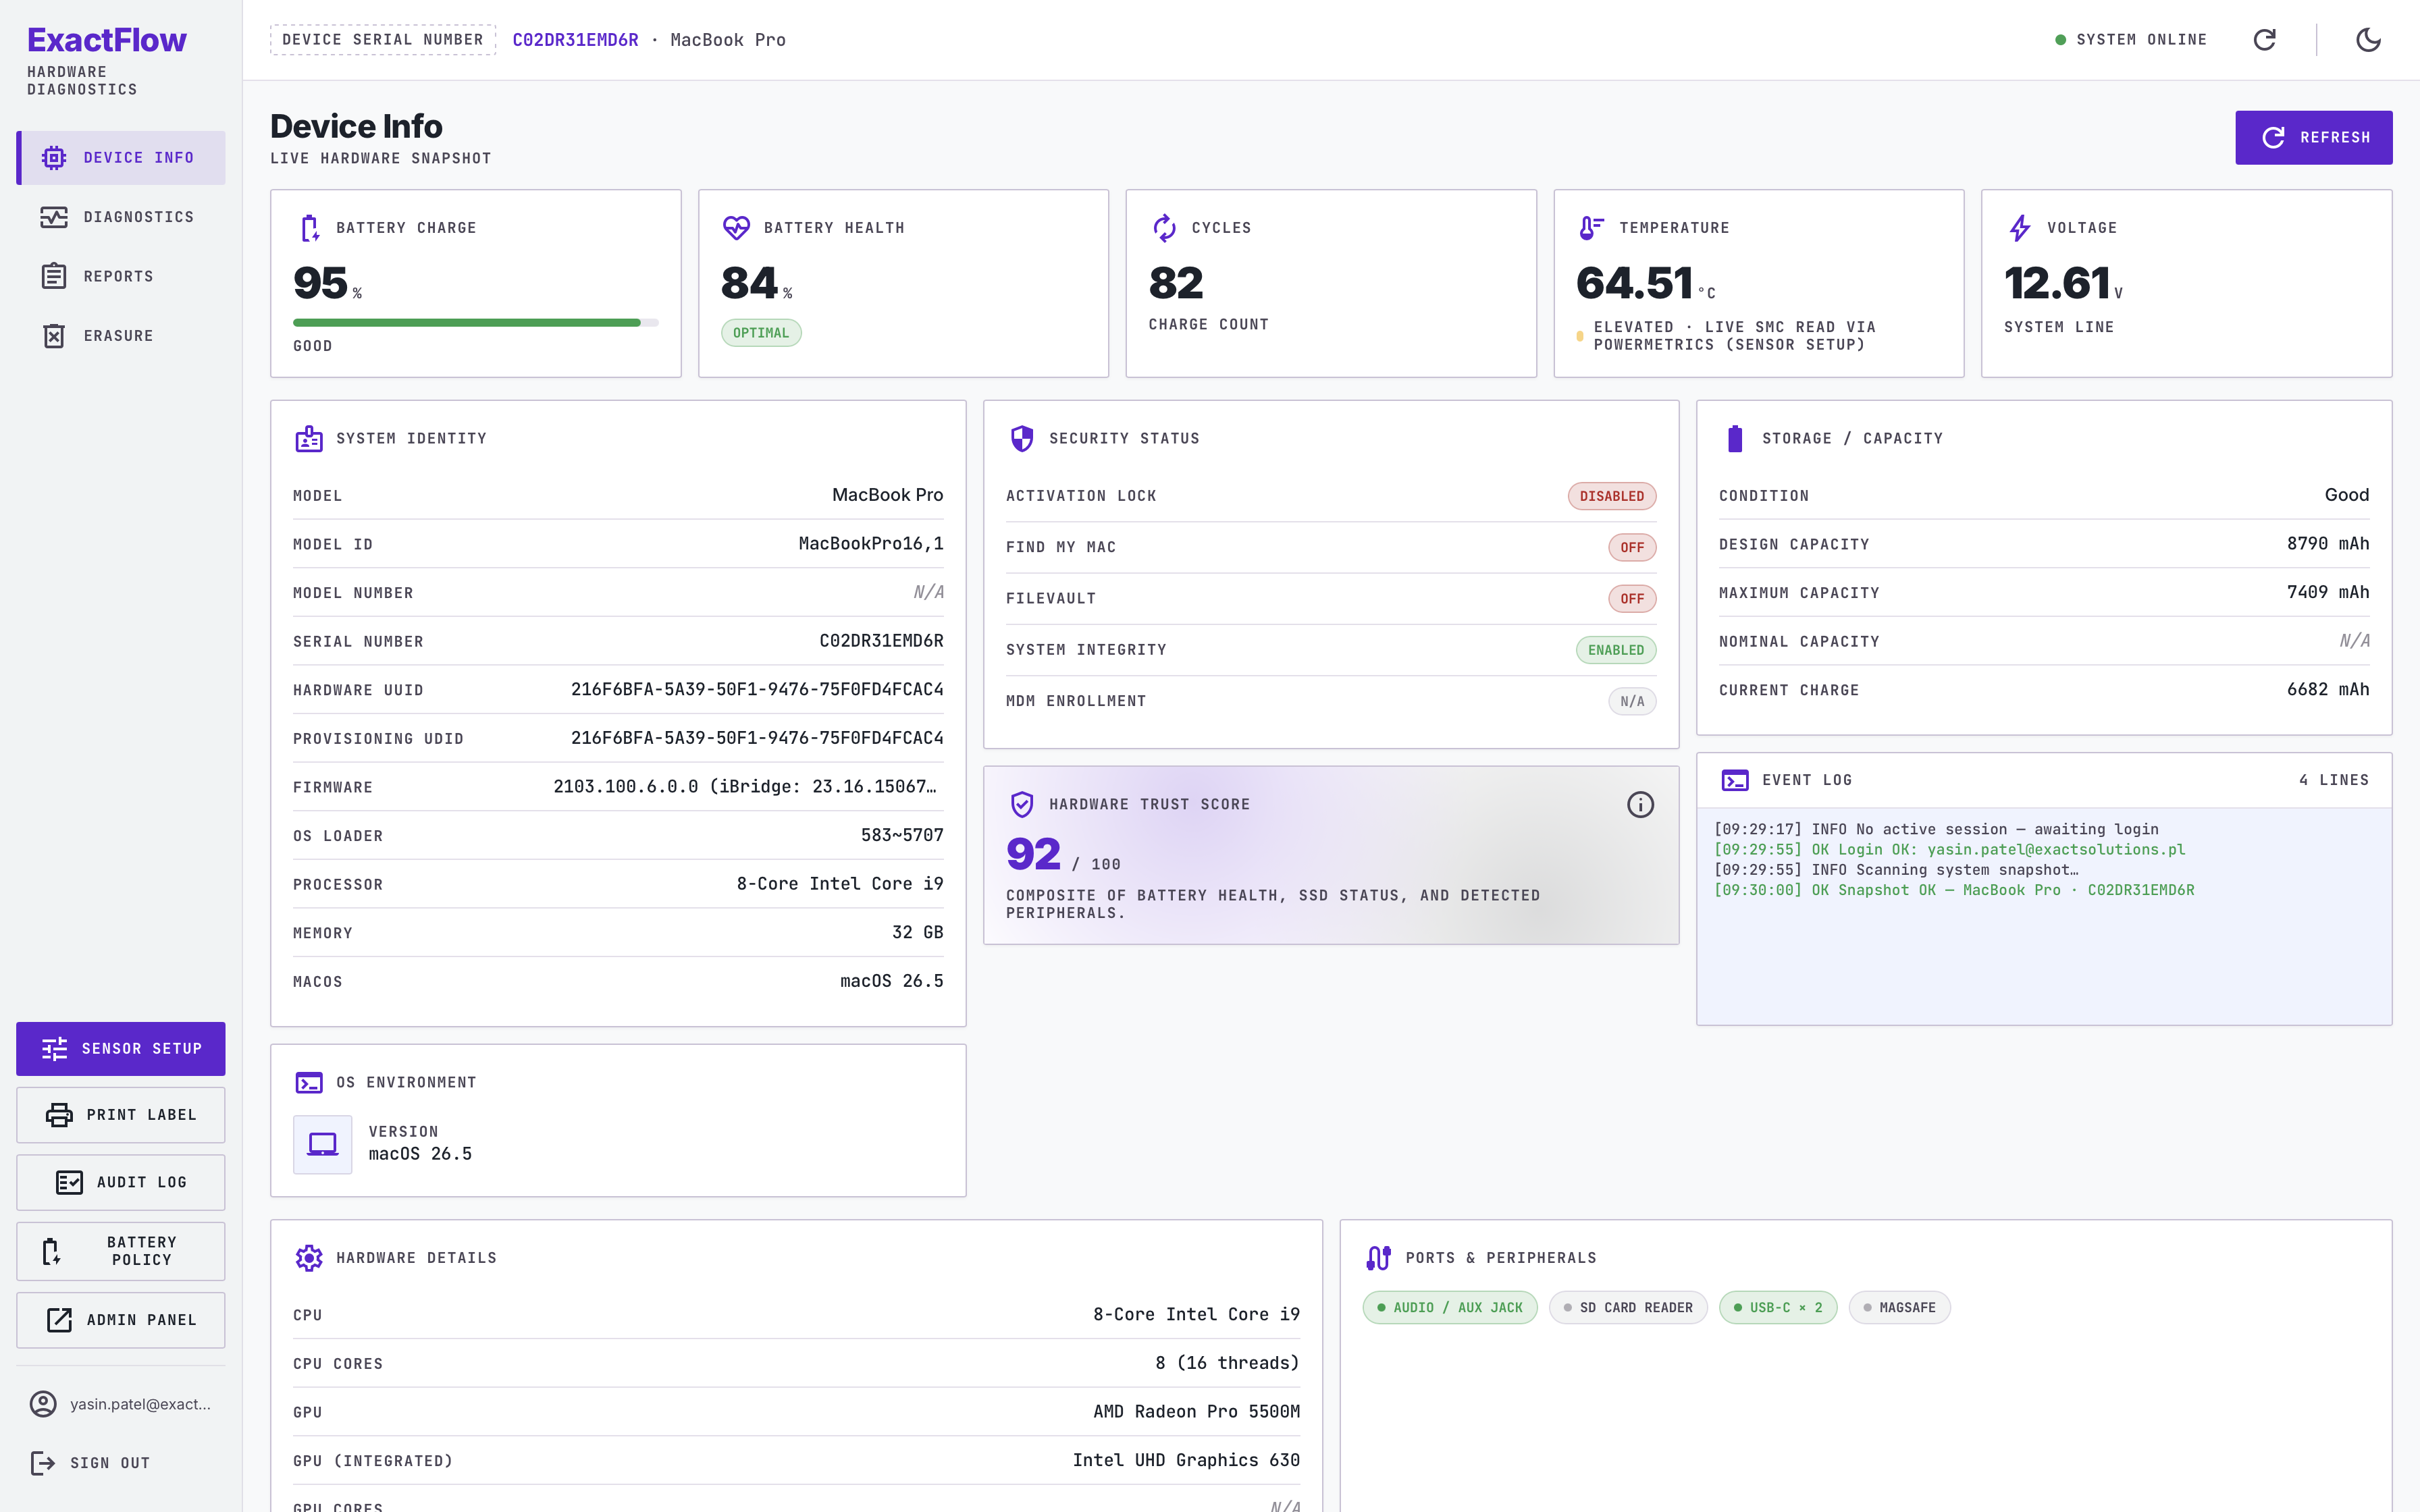
Once the application is successfully installed and opened, users can access the available modules from the navigation panel located on the left side. The Device Info module provides a live hardware snapshot of the current device and its environment. Key information includes: -System Identity, Device hardware information, system information, Security status related details such as Activation Lock, Find My, FileVault, and MDM status. Temperature and fan-speed information requires a one-time Sensor Setup: 1. Open Sensor Setup from the left-hand navigation panel. 2. Follow the prompts to install the required sensors. 3. Once installed, the application can display temperature and fan-speed information. Note: The Device Info module is designed to provide a quick, easy-to-understand overview of the device's current hardware and security status.
Step 5:
Application Overview — Diagnostics
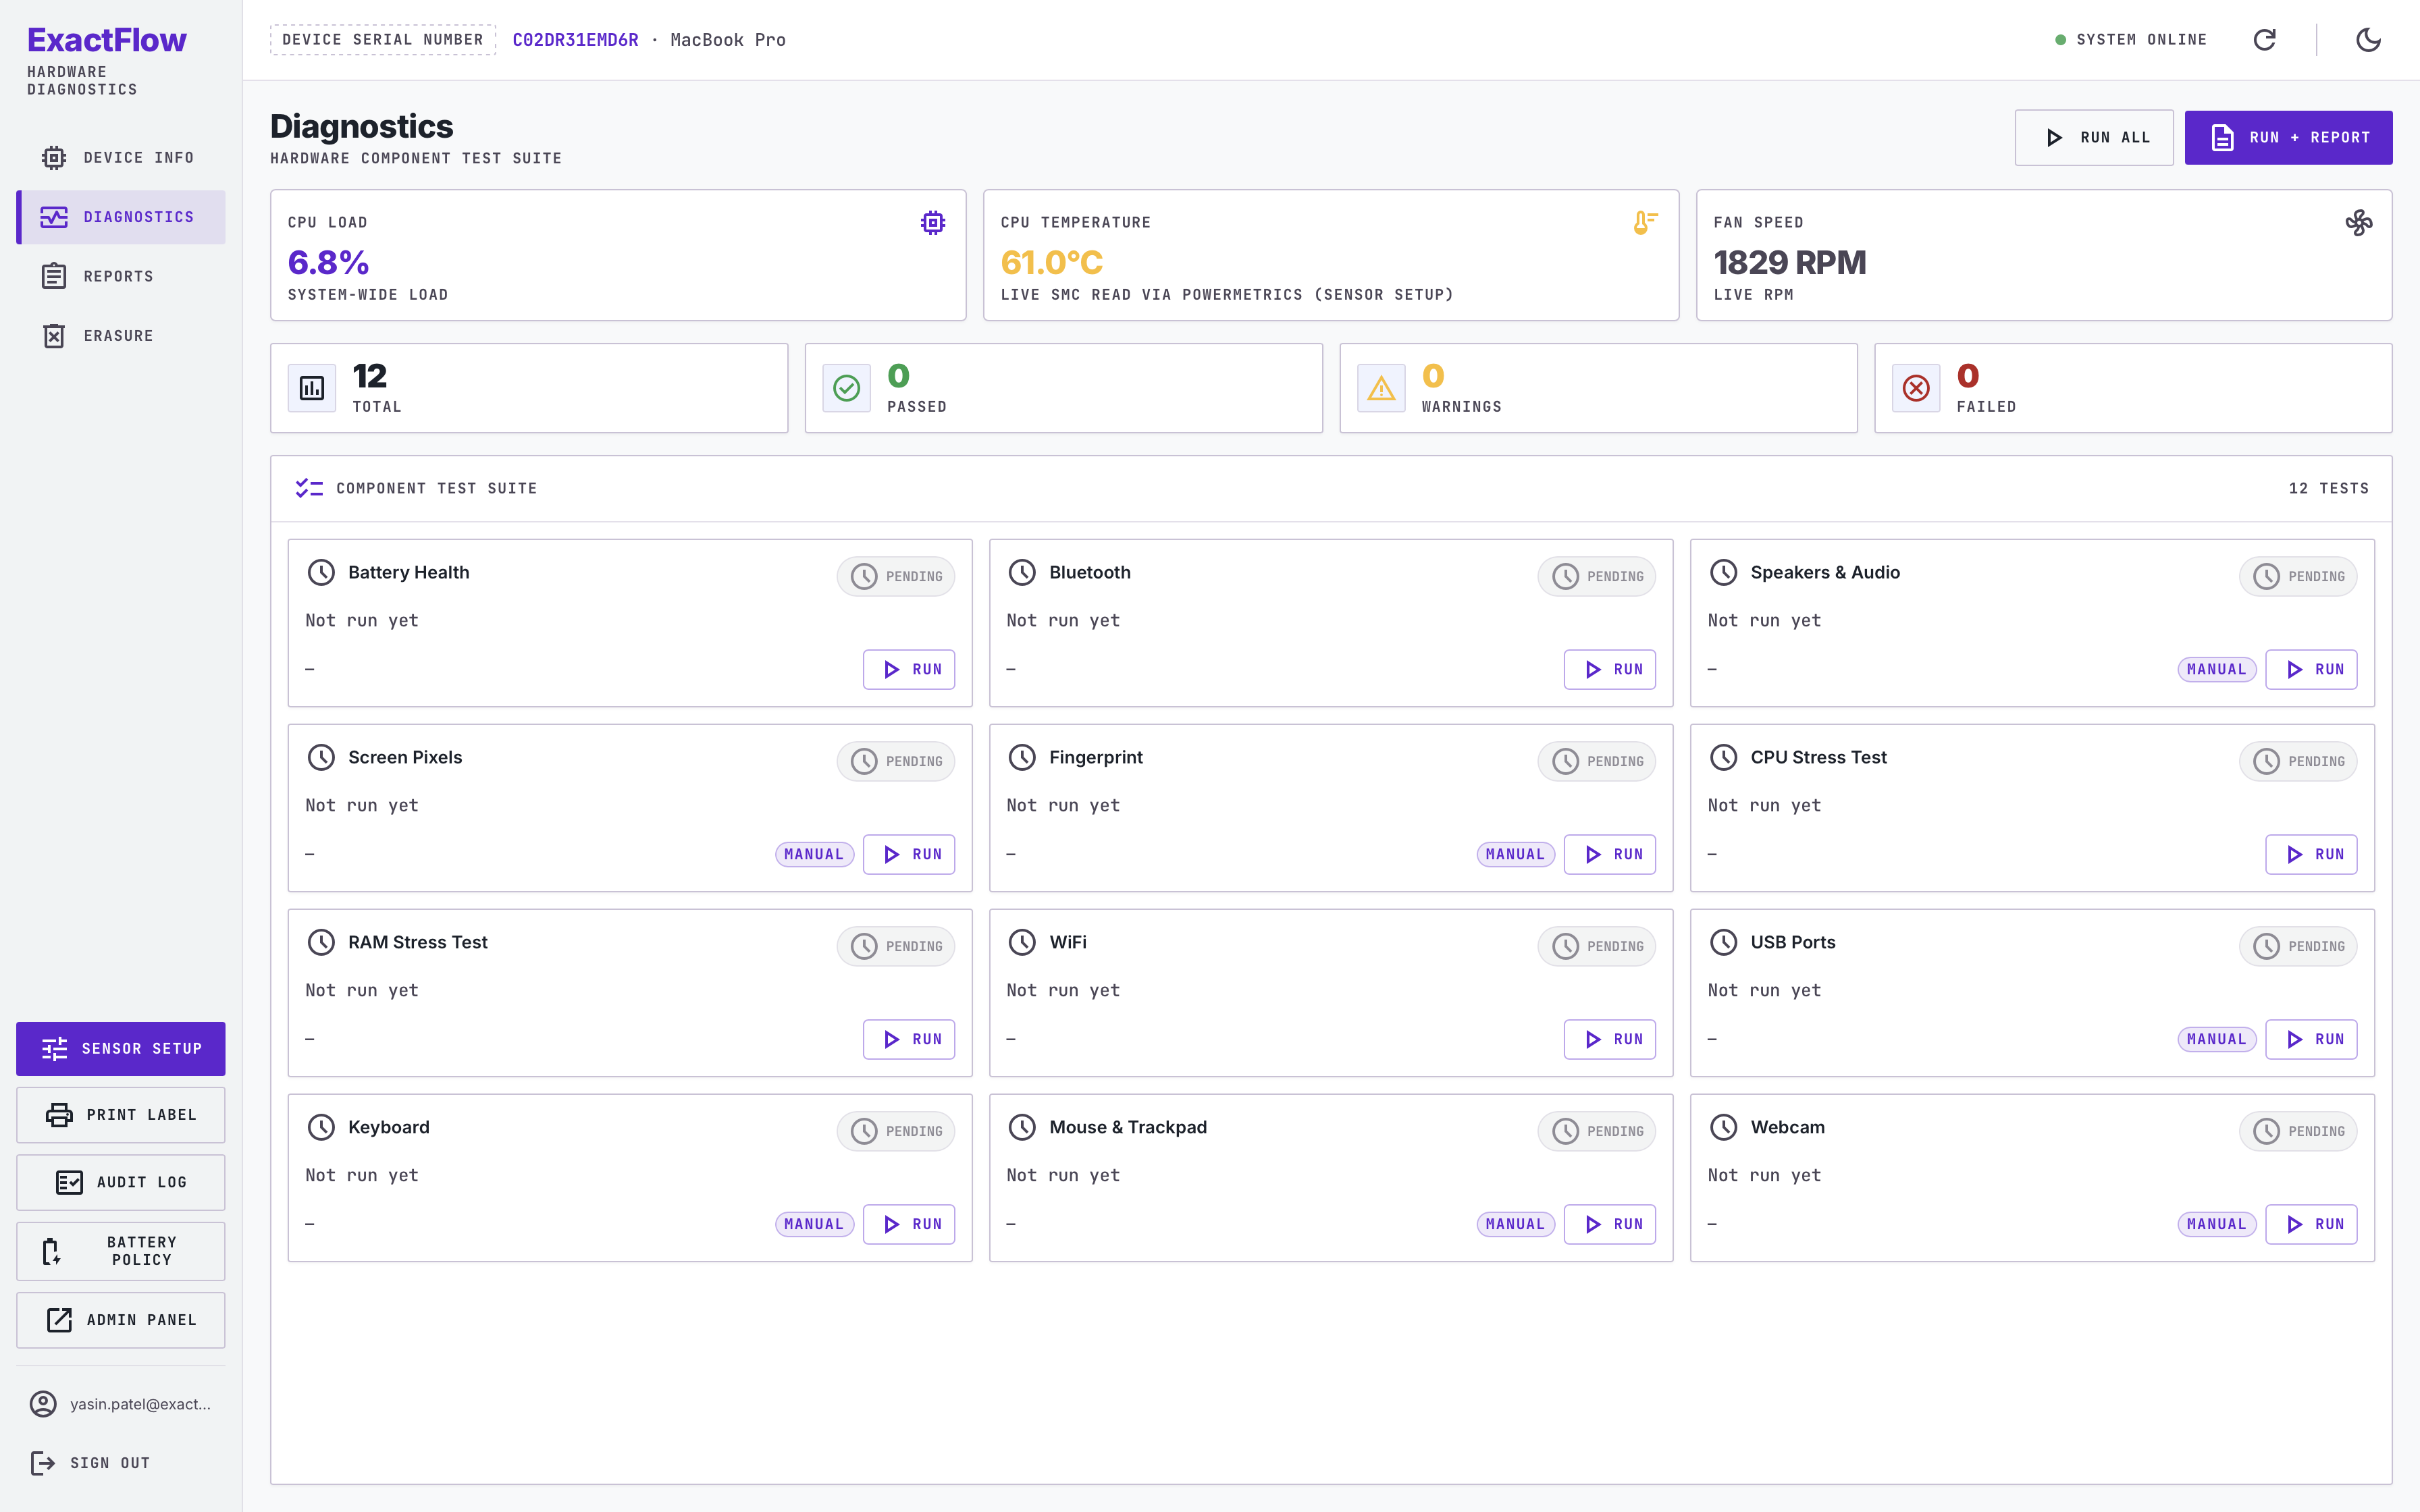
The Diagnostics module allows users to test individual device components or run a complete diagnostic. Running Diagnostics Users have three options in the top-right corner: Run All — Runs all available component tests. A report is not generated automatically; once testing is complete, users can select Generate Report. Run + Report — Runs all tests and generates a report automatically. Individual Tests — Users can run any component test separately without generating a report. Component Testing: Most tests allow users to Mark Pass or Fail based on the test result. Examples: -Speakers & Audio: Test individual speakers and microphone functionality. Users can listen to recordings, retry the test, or mark it as Pass/Fail. -Screen Pixels:The display cycles through different colors automatically. Users can also switch co lors manually and mark any color where a display issue is detected. -Keyboard: Users can test all keys or mark specific keys that require attention. Any flagged keys are included in the final report. -Fingerprint: If a fingerprint is enrolled, the application prompts the user to verify it. Otherwise, the user is guided to the relevant system settings. -USB Ports: Connect a device and the application automatically detects it. Users can mark the corresponding port as Working or Not Working. An Undo option is available if an incorrect selection is made. Each completed module also provides a brief summary of the test performed and its result. Generated reports can be accessed from the Diagnostics panel. A preview is provided before the report is finalized, with options to: Print a label or Preview the label before printing or Upload the report to the cloud SKU & Database Information: The application can also retrieve SKU and related device information from the database. The database is currently managed privately.
Step 6:
Application Overview — Reports
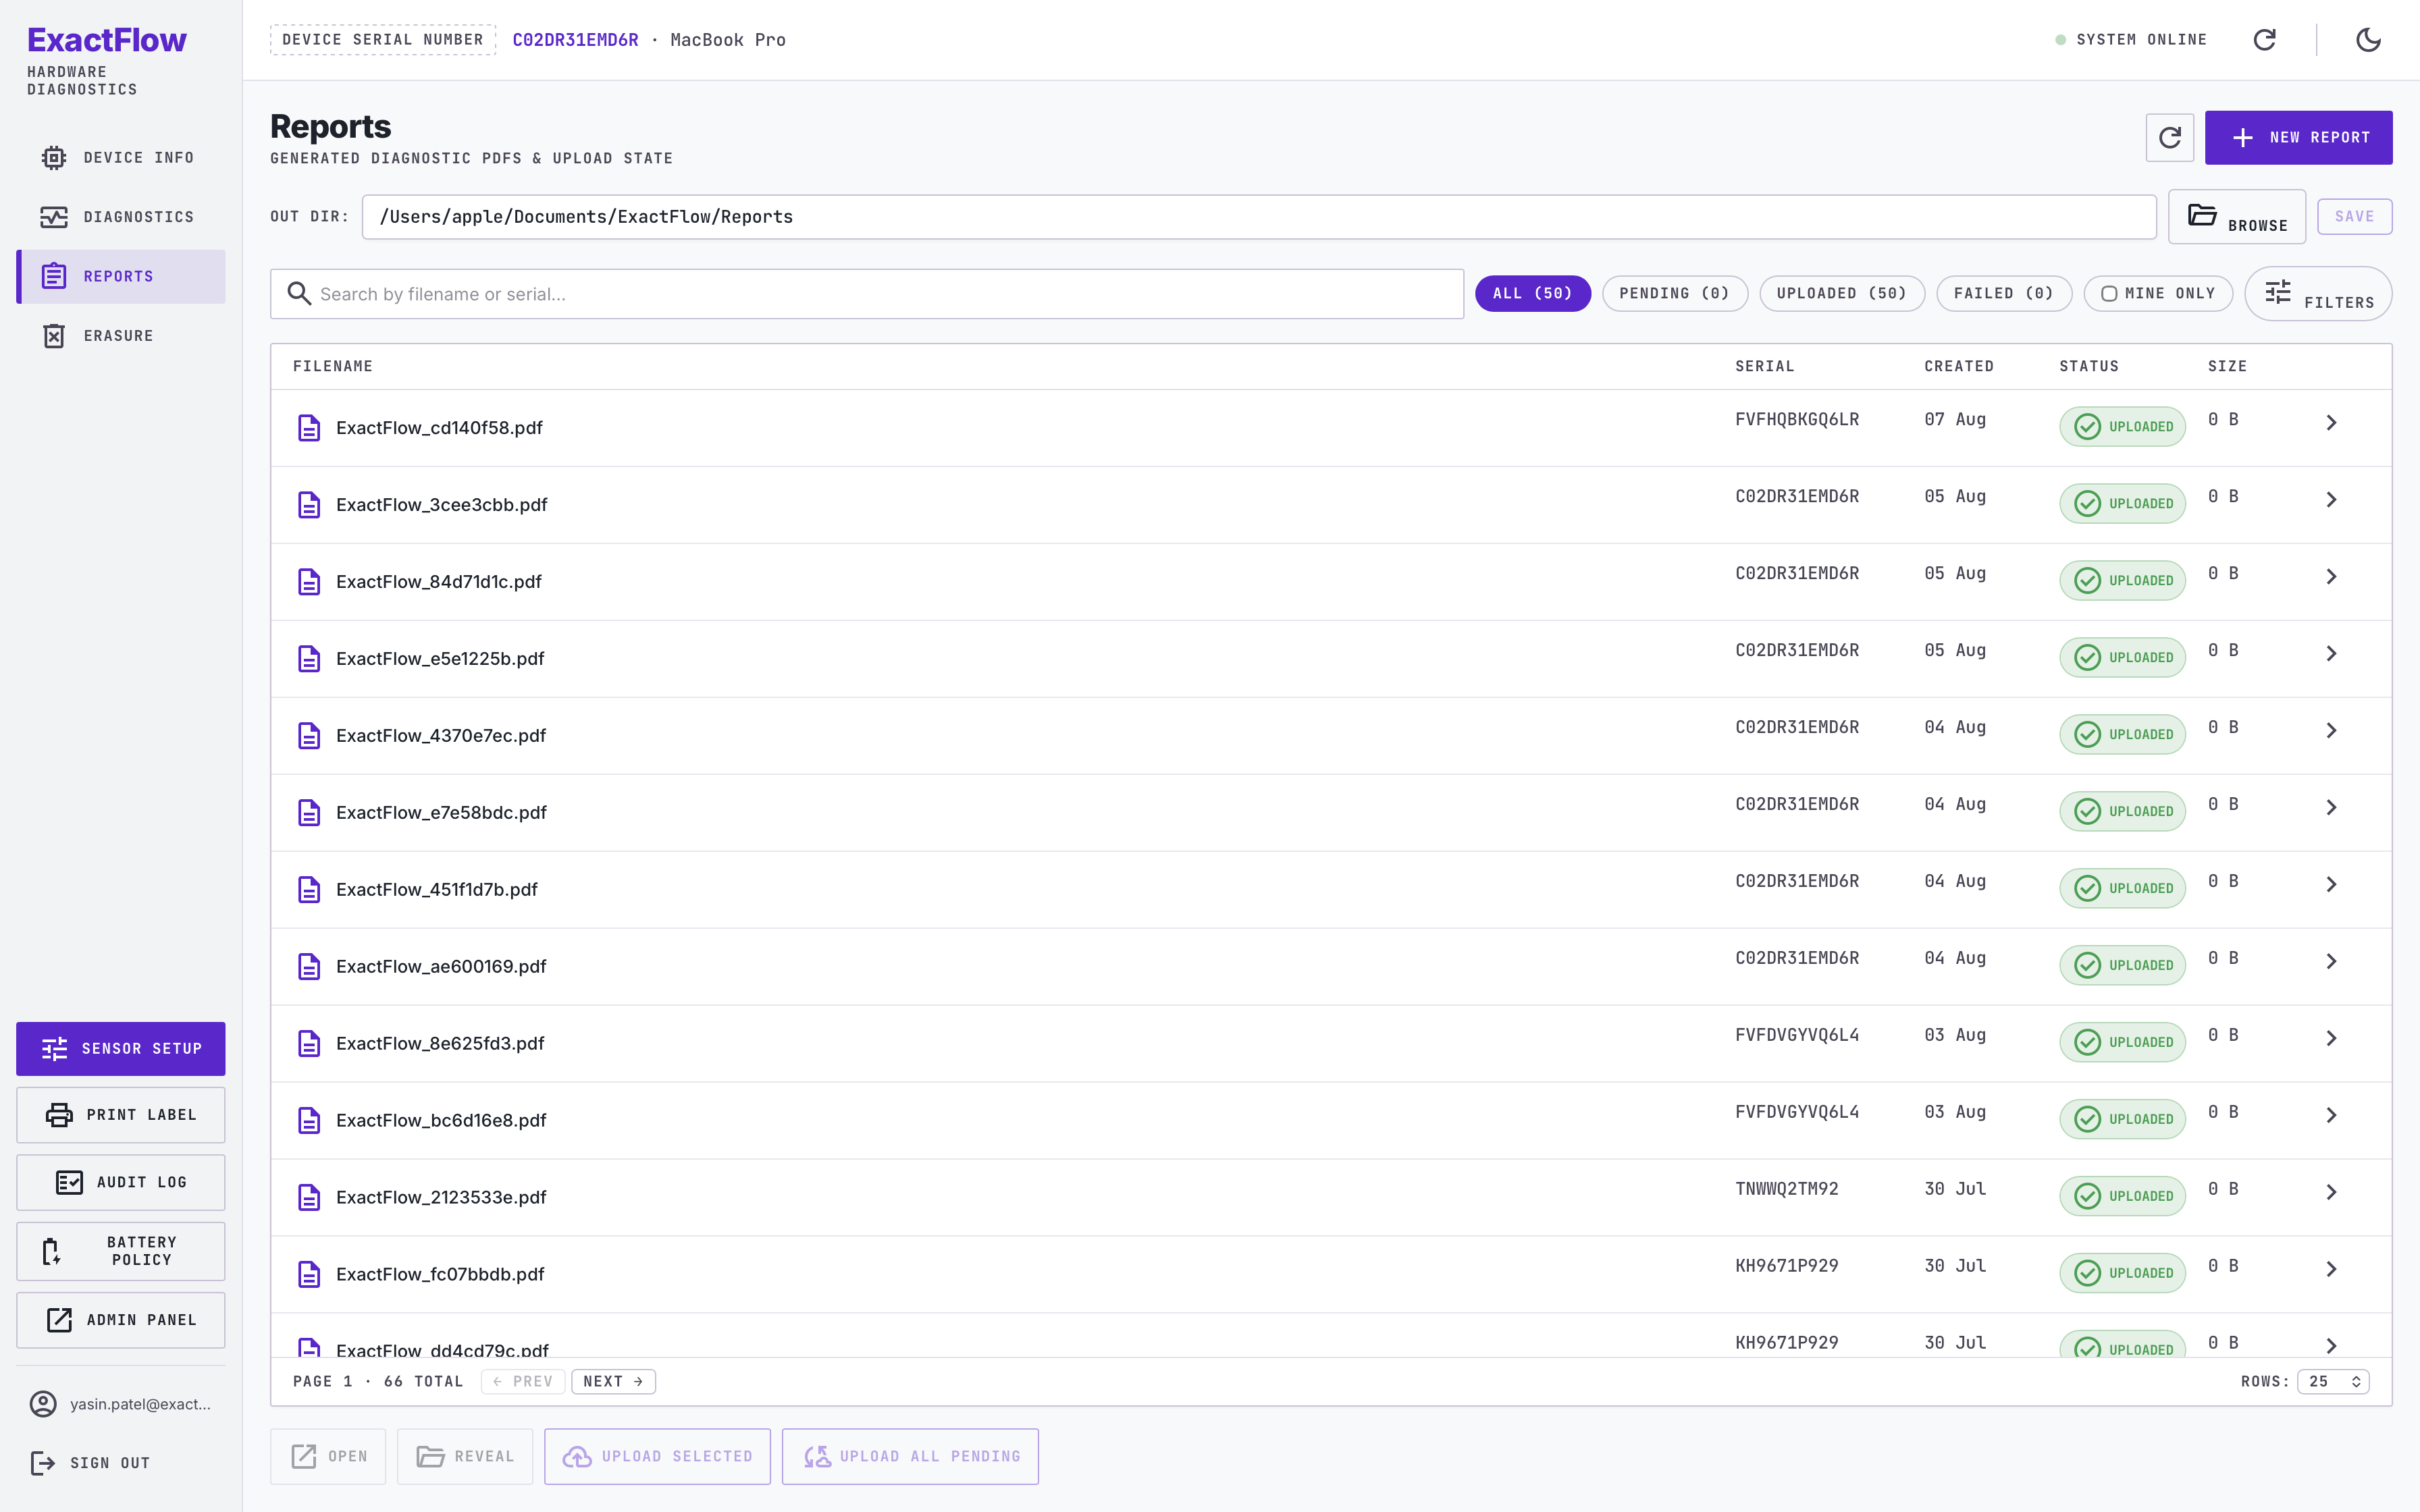
The Reports section displays all reports generated by the currently logged-in user. To view a report, double-click the report row or click the arrow icon on the right. Users can select individual reports and upload them to the cloud. Upload All Pending allows users to upload all pending reports at once. Note Administrators can view reports generated by all users through the Web Portal.
Step 7:
Application Overview — Erasure
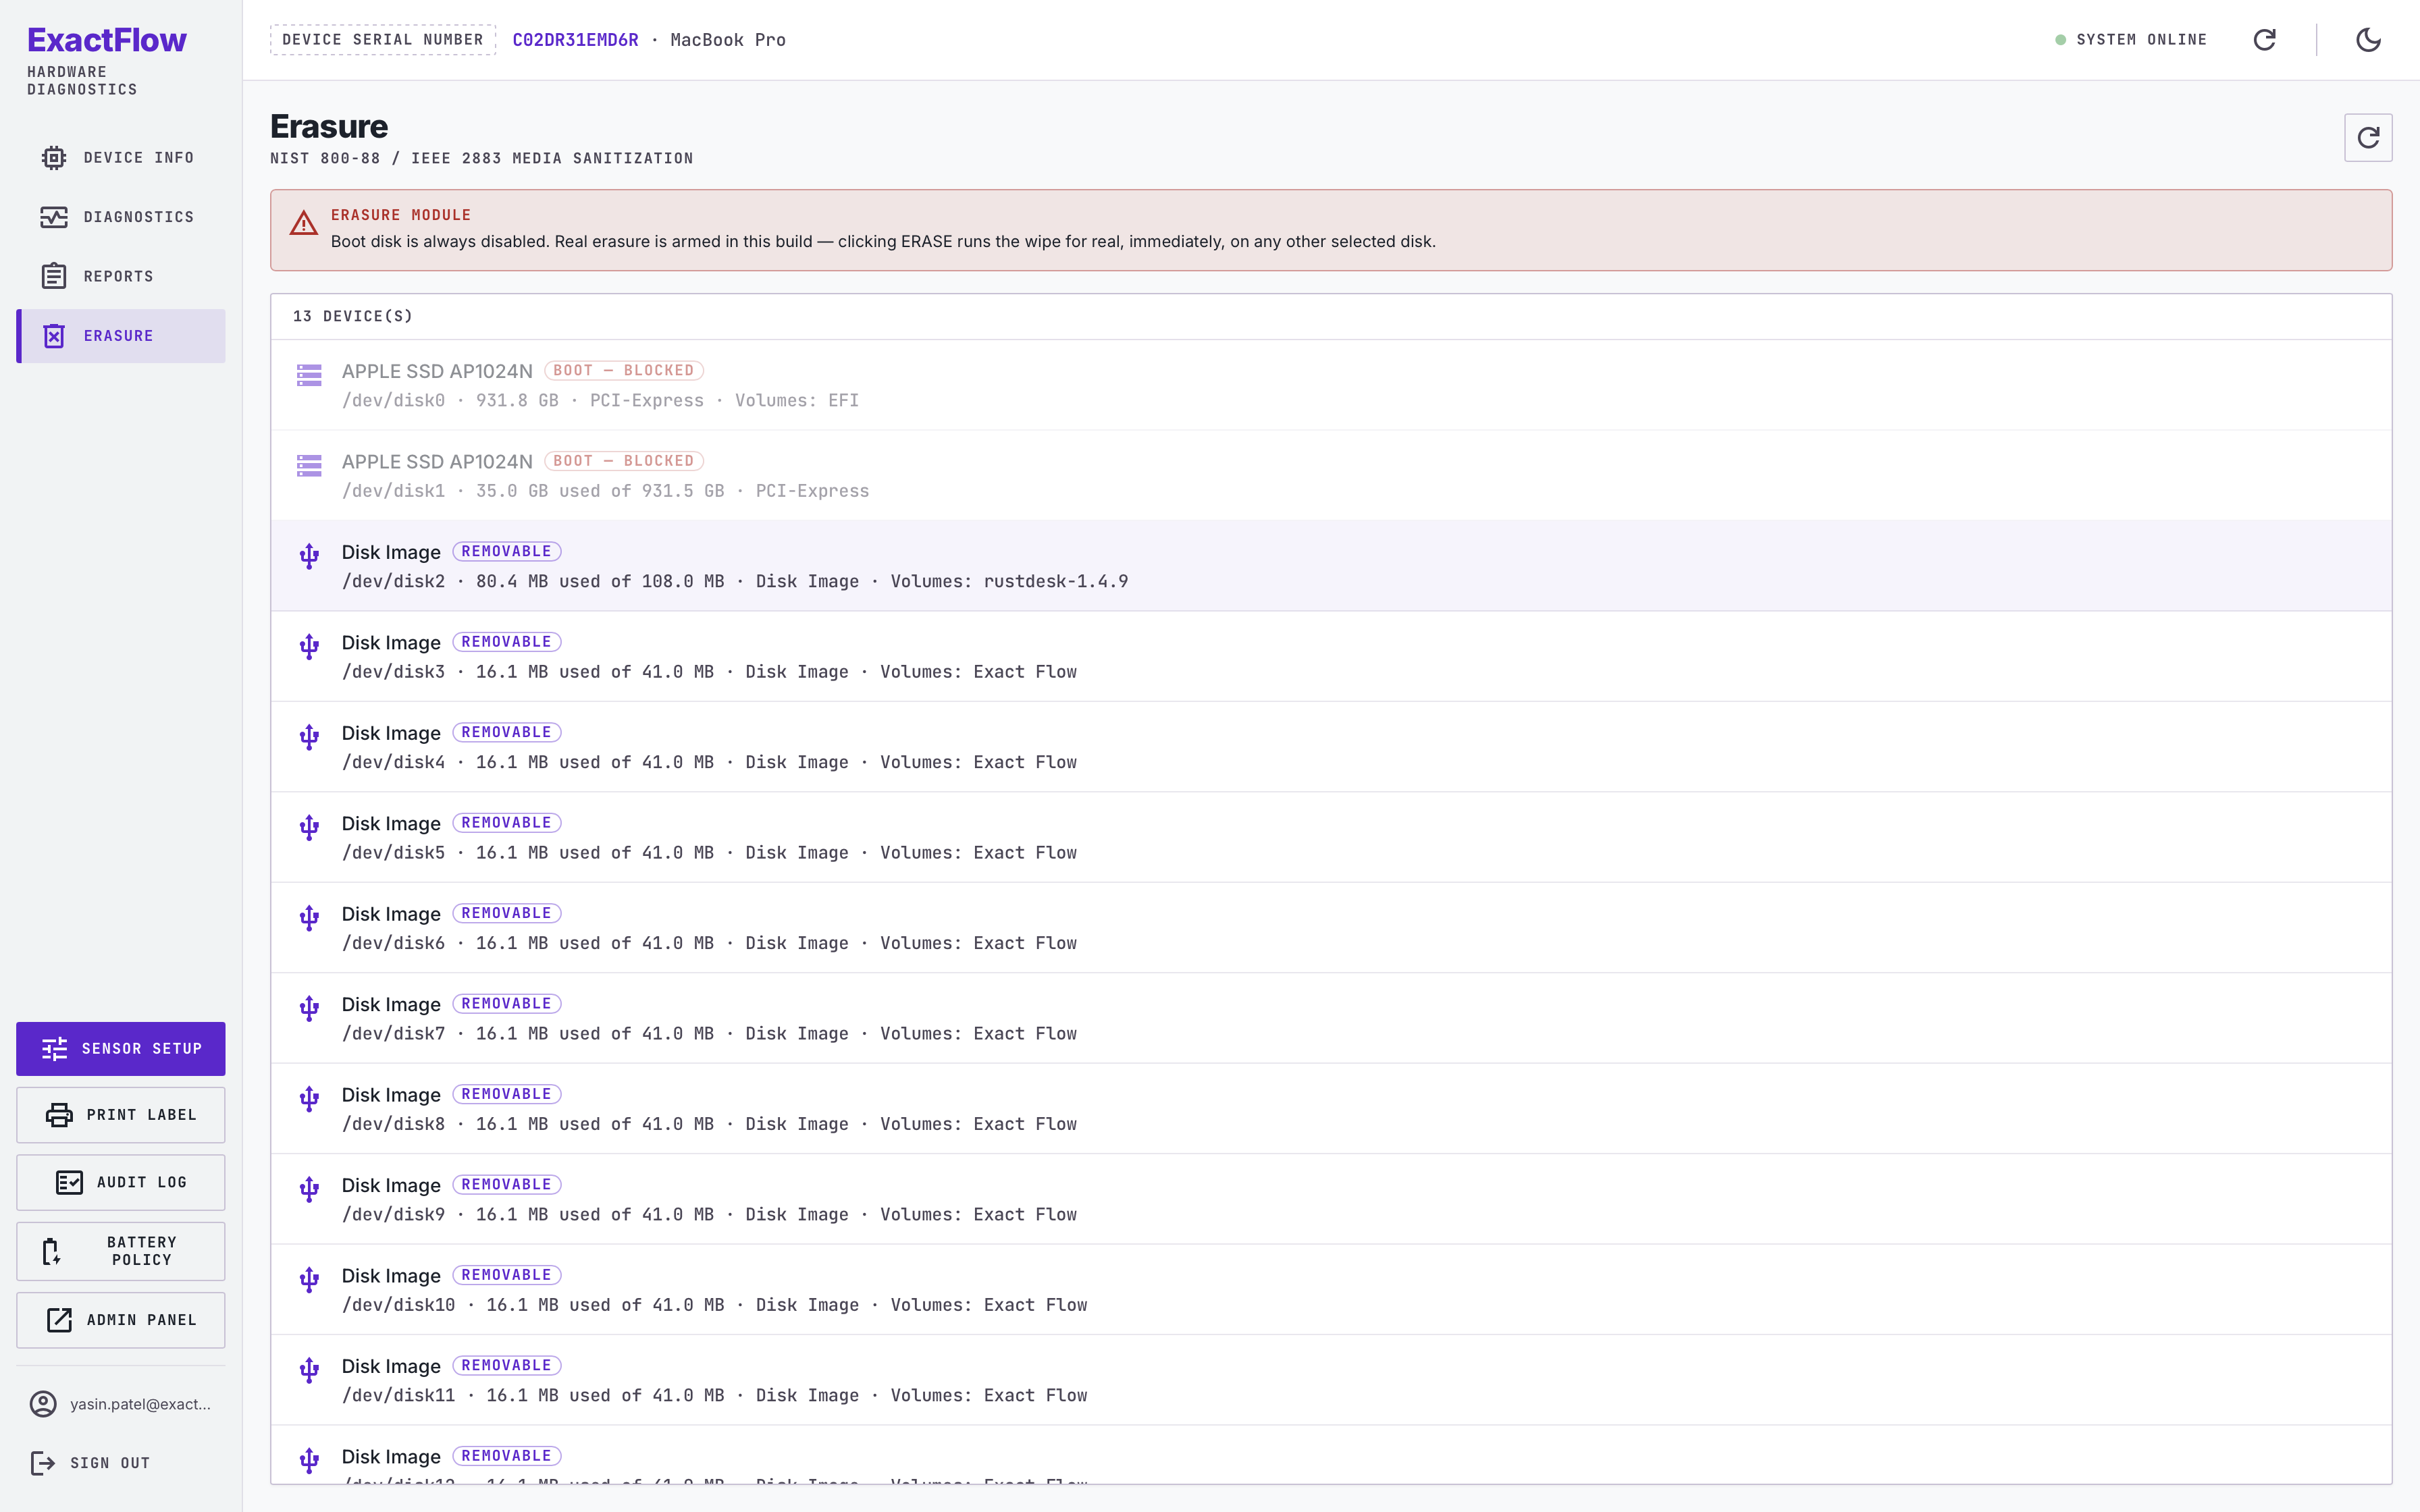
Erasure module allows users to securely erase data from connected drives. Select the drive you want to erase from the list. If a drive is not displayed, click Refresh icon in the top-right corner to rescan the available drives. Each drive can be erased using one of the following methods: - Single-Pass Zero: Writes zeros to every sector of the drive. This is a fast method for clearing data. -3-Pass DoD 5220.22-M: Performs three overwrite passes using different data patterns, followed by verification. 7-Pass NIST 800-88: Performs a multi-pass data sanitization process based on the NIST 800-88 standard. Dry Run: The Dry Run option performs a Single-Pass Zero operation in dry-run mode, allowing users to test the erasure process without performing the full intended operation.
Step 8:
Application Overview — Navigation Panel & Miscellaneous
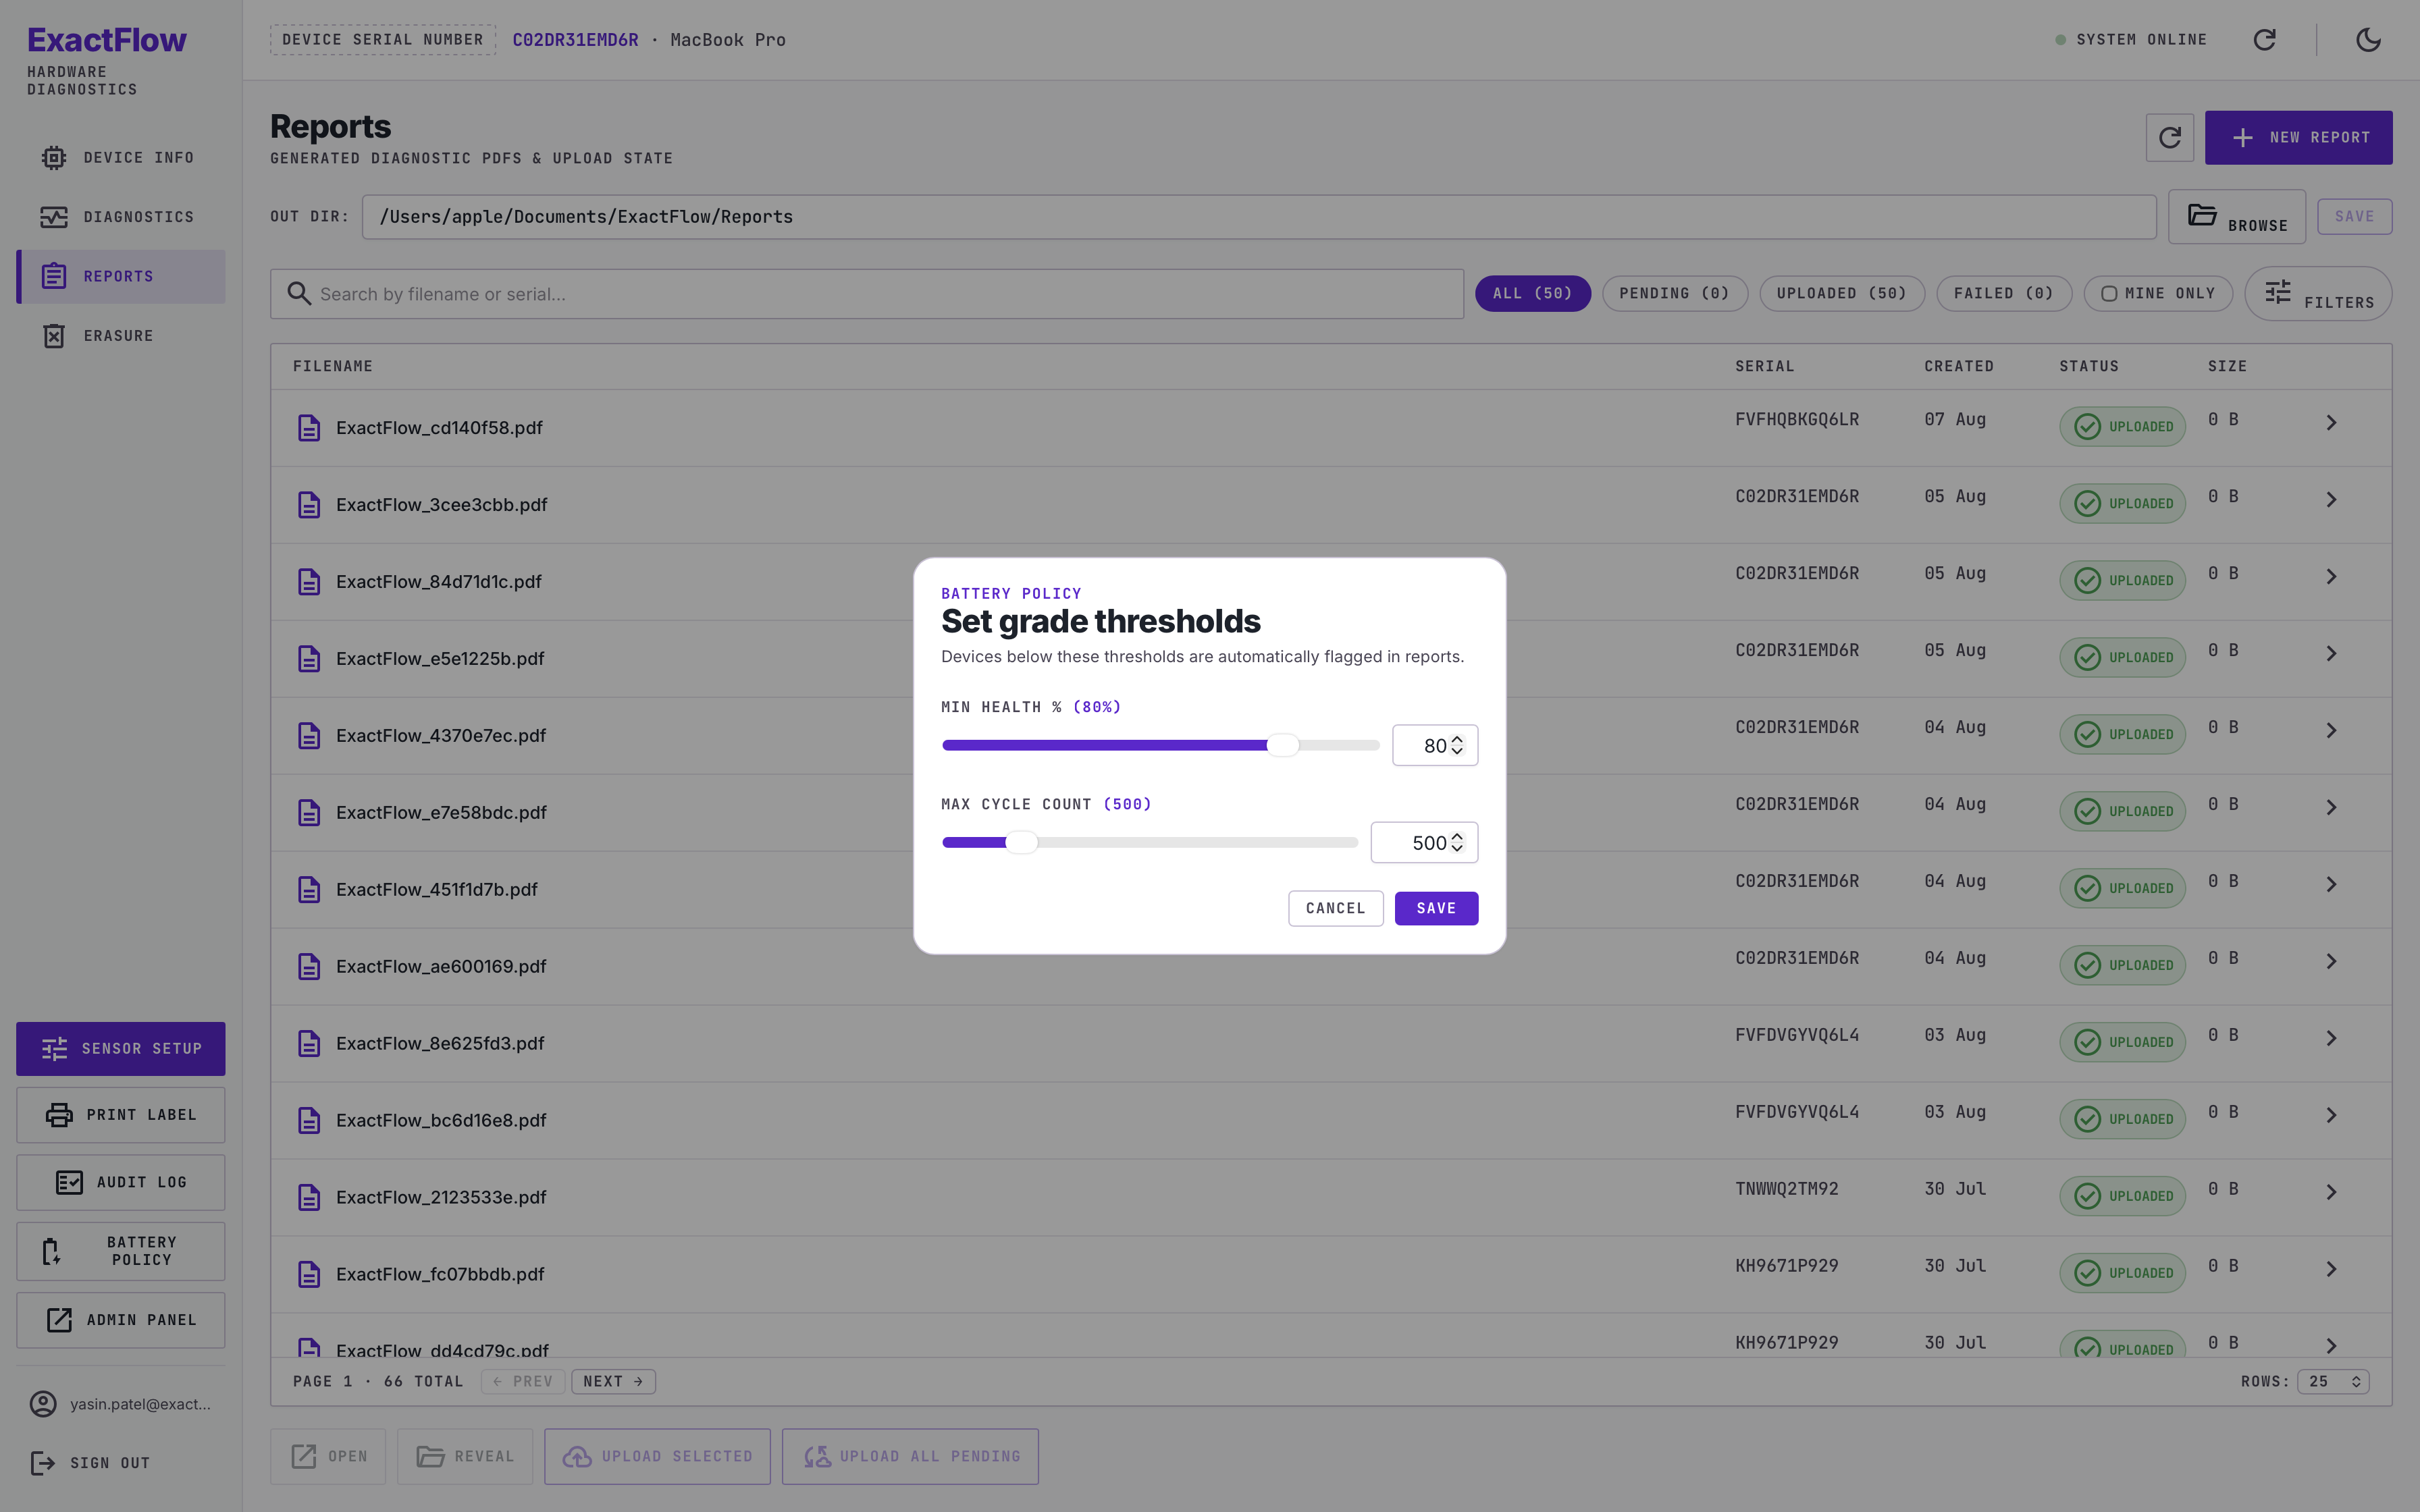
The application uses a left-hand navigation panel to provide quick access to all available modules. -Main Modules: The primary application functions are located at the top of the navigation panel: Device Info | Diagnostics | Reports | Erasure -Additional Modules: Additional tools are available at the bottom of the navigation panel: Sensor Setup | Print Labels | Audit Log | Battery Policy | Admin Panel - Light & Dark Mode: A global Light/Dark Mode can be changed at any time using the toggle in the top-right corner. In light Mode click on Moon icon and in dark mode click on sun icon. The icon changes automatically based on the selected theme. Battery Policy allows administrators to define the required battery condition. During diagnostics, if a device does not meet the configured battery requirement, the Battery result will be marked as Failed in the report. The Admin Panel provides access to the administrative Web Portal. Note: The Admin Panel is available only to authorized administrators.
We Think You Might Like These Tutorials
Liked this tutorial? Check out some more tutorials from our community:
 Zip Tutorials